2021 ASCE Report Card: First Time US Infrastructure Grading Out of D Range in 20 Years
March 10, 2021
2021 ASCE Report Card
Every four years, the American Society of Civil Engineers (ASCE) Committee on America’s Infrastructure provides a comprehensive assessment of the nation’s 17 major infrastructure categories in ASCE’s Report Card for America’s Infrastructure. Using an A to F school report card format, the Report Card examines current infrastructure conditions and needs, assigning grades and making recommendations to raise them.
The grading is as follows:
- A – Exceptional, fit for the future
- B – Good, adequate for now
- C – Mediocre, requires attention
- D – Poor, at risk
- F – Failing, critical, unfit for purpose
The good news, the grade is up from a D+ to a C- from 2017. However, there is still work to be done.
Industry Impact
 Sarah Matin, Client Development Leader for our Transportation Business Unit participated in her 10th annual Legislative Fly-In last week, advocating for federal infrastructure investment with members of Congress alongside 250 other ASCE members from around the country.
“I know that all of our representatives appreciate the Report Card because it’s typically something that doesn’t get partisan pull. They know we’re talking to them from a background of facts and knowledge and specs, and all that good data that we so love. And I think they appreciate that because they can bring that information forward and help win over their constituents.”
We asked Sarah her thoughts on what this might mean for the industry.
“The Report Card on America’s Infrastructure is a measuring stick for many. It provides a road map for the current state of infrastructure systems and a clear summary of what shortfalls exist. The report card also gives insight into where the Federal government, state, and local municipalities need to allocate funds to improve failing systems, in addition to shedding light on infrastructure systems that play a critical role in commerce and public safety.”
Infrastructure Category Grading
 Aviation: D+
Under pre-COVID-19 projections, our aviation system was set to have a 10-year, $111 billion funding shortfall, and that gap has likely grown significantly as passenger volumes dropped in March 2020 and have yet to recover. Funding from Congress has risen from $11 billion annually to approximately $15 billion from 2017 to 2020.
 Bridges: C
Currently, 42% of all bridges are at least 50 years old, and 7.5% are considered structurally deficient, or in “poor” condition. In recent years, as the average age of America’s bridges increases to 44 years, the number of structurally deficient bridges has continued to decline; however, the rate of improvements has slowed.
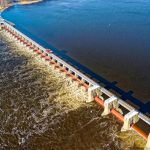 Dams: D
Over the last 20 years, the number of high-hazard-potential dams has more than doubled as development steadily encroaches on once-rural dams and reservoirs.
 Drinking Water: C-
Our nation’s drinking water infrastructure system is made up of 2.2 million miles of underground pipes that deliver safe, reliable water to millions of people, but is aging and underfunded. More than 12,000 miles of water pipes were planned to be replaced by drinking water utilities across the country in 2020.
 Energy: C-
Utilities are taking proactive steps to strengthen the electric grid through resilience measures. However, weather remains an increasing threat. In the coming years, additional transmission and distribution infrastructure, smart planning, and improved reliability are needed to accommodate the changing energy landscape, as delivery becomes distributed and renewables grow.
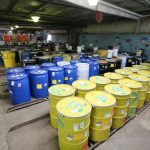 Hazardous Waste: D+
There are an estimated 35 million tons of hazardous materials managed annually in the United States. In general, there is adequate capacity for the treatment and disposal of these materials through the year 2044. However, progress toward mitigating legacy sites where hazardous waste was produced and improperly disposed of has stalled.
 Inland Waterways: D+
Inland waterway infrastructure includes locks and dams as well as navigation channels. Recent boosts in federal investment and an increase in user fees have begun to reverse decades of declining lock and dam conditions, with unscheduled lock closures reaching a 20-year low in 2017. While this is encouraging, the system still reports a $6.8 billion backlog in construction projects and ongoing lock closures — totaling 5,000 hours between 2015 and 2019 — harming the industries that rely on the waterways to get their goods to market.
 Levees: D
The USACE estimates that $21 billion is needed to improve and maintain the moderate to high-risk levees in its portfolio, which represents only about 15% of the known levees in the U.S.
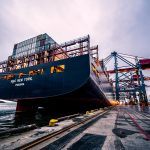 Ports: B-
Ports and port tenants plan to spend $163 billion between 2021 and 2025, up by over $8 billion in the last four years.
 Public Parks: D+
Despite their increased popularity, investment in parks is lagging, resulting in deteriorating bridges, trails, parking areas, drinking water systems, and more. State parks and local parks face a $5.6 billion and $60 billion deferred maintenance backlog, respectively.
 Rail: B
While freight maintains a strong network largely through direct shipper fees — investing on average over $260,000 per mile — passenger rail requires government investment and has been plagued by a lack of federal support, leading to a current state of good repair backlog at $45.2 billion.
 Roads: D
Federal, state, and local governments will need to prioritize strategic investments dedicated to improving and preserving roadway conditions that increase public safety on the system we have in place, and a plan for the roadways of the future, which will need to account for connected and autonomous vehicles.
 Schools: D+
The best estimates indicate a minimum of $38 billion annual funding gap for public school facilities across the country.
 Solid Waste: C+
The U.S. MSW management system faces growing challenges such as plateauing recycling rates, emerging contaminants found in legacy landfills, and significantly changing global markets. Funding mechanisms are needed to invest in a nationwide solid waste infrastructure system.
 Stormwater: D
While stormwater utilities are on the rise, with more than 40 states having at least one, the impervious surfaces in cities and suburbs are also expanding, exacerbating urban flooding, which results in $9 billion in damages annually.
Transit: D-
Over a 10-year period across the country, 19% of transit vehicles, and 6% of fixed guideway elements like tracks and tunnels were rated in “poor” condition. Currently, there is a $176 billion transit backlog, a deficit that is expected to grow to more than $270 billion through 2029.
 Wastewater: D+
In 2019, though the annual water infrastructure capital investment gap was $81 billion, the sector has made strides to address current and future needs through resilience-related planning and innovations that produce profitable byproducts or cost savings from wastewater treatment.
Read the Full Report and Executive Summary here.